Financial Review
Review of Operations
In the automobile industry during the fiscal year ended March 31, 2013, sales in Japan exceeded the level recorded in the previous fiscal year due to the positive effects of an incentive to buy eco-cars in the first half of the year and an increase in sales of smaller sized cars (“kei” category cars). Sales were also favorable in the Americas and Asia.
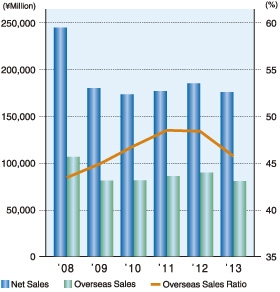
Within this market environment, the Clarion Group strived to reduce costs in a thoroughgoing manner by undertaking production in optimal locations from a global perspective and promoting the overseas transfer of procurement and mass-production development functions. At the same time, we made group-wide efforts to curb fixed costs in order to build a profitable corporate structure. In fiscal 2012, the Clarion Group recorded consolidated net sales of ¥177,288 million, down 5.0% from the previous fiscal year. Despite sales growth centering on original equipment manufacturer (OEM) markets in Japan and the emerging nations of Southeast Asia, net sales were affected by sales declines in European and U.S. markets.
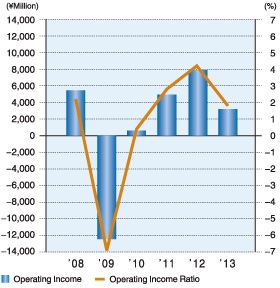
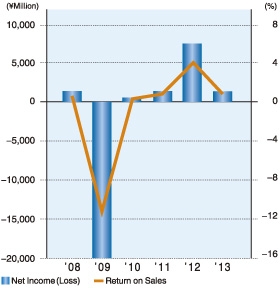
With regard to income, consolidated operating income decreased 59.2% year-on-year to ¥3,210 million due to a decline in the installation rate of high-end products and a rise in development expenses. Additionally, based on considerations of recoverability in view of recent business results, Clarion wrote off a portion of deferred tax assets. As a result, net income declined 82.0% from the previous fiscal year to ¥1,358 million.
Results by geographic segment (excluding intra-Group transactions) are as follows.
■ Japan
Although domestic new car sales volume increased 10% from the previous fiscal year, sales of high-end products declined.
Segment sales amounted to ¥96,406 million, down 0.5% year-onyear.
Segment income stood at ¥1,963 million, a decrease of 69.0%, due to the aforementioned change in product composition and a rise in development expenses.
■ Americas
New car sales in the United States rebounded to pre-financial crisis levels, reflecting such factors as signs of economic recovery and easier financing that accompanied an improvement in the employment situation. Nevertheless, sales declined due mainly to the impact of such factors as the termination of sales of high-end products in the first half of the fiscal year arising from a switchover in car model years by major customers. Other negative factors included the standardization of accounting periods in the previous fiscal year of companies that had used the calendar year for account settlement.
Segment sales amounted to ¥54,288 million, down 12.5% yearon- year. Segment income decreased 42.8% to ¥761 million due to the decline in sales.
■ Europe
While a lull in the ongoing European sovereign-debt and financial crisis continued, the severe employment situation persisted. Segment sales decreased 10.2% year-on-year to ¥9,733 million due mainly to sluggish sales in the OEM market and the impact of the weakening of the euro compared with the previous fiscal year.
Segment loss amounted to ¥0 million (compared with segment income of ¥2 million in the previous fiscal year) as a result of a decline in sales despite efforts to reduce selling, general and administrative expenses.
■ Asia and Australia
Favorable sales were recorded in Southeast Asian OEM markets in line with the start of operations at the new Thai Factory. However, segment sales declined 0.4 % year-on-year to ¥16,861 million primarily as a result of sluggish sales of Japanese vehicles in China as well as the standardization of accounting periods in the previous fiscal year of companies that had used the calendar year for account settlement.
Segment income decreased 19.1% to ¥323 million due mainly to a decrease in sales.
Segment income/loss refers to operating income/loss.
Forward-Looking Statements
The figures contained in this report with respect to Clarion’s plans and strategies and other statements that are not historical facts are forward-looking statements about the future performance of Clarion. Such statements are based on management’s assumptions and beliefs in light of the information currently available to it and involve risks and uncertainties. Actual results may differ from those in the forward-looking statements as a result of various factors. Potential risks and uncertainties include, without limitation, general economic conditions in Clarion’s market.
Financial Position
Current assets at fiscal year-end decreased ¥10,436 million, or 13.6%, compared with the previous fiscal year-end to ¥66,395 million.
This result was due to a ¥6,046 million decrease in cash on hand and in banks, a ¥3,773 million decrease in trade notes and accounts receivable and a ¥2,185 million decrease in inventories.
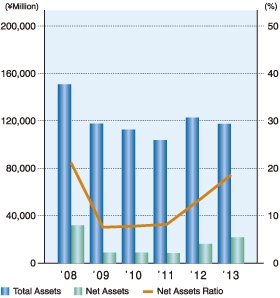
Property, plant and equipment, net, increased ¥2,657 million, or 11.5%, from the previous fiscal year-end to ¥25,767 million. This was attributable to an increase in machinery and equipment in line with the start of operations at the new Thai Factory. Intangible assets increased ¥1,656 million, or 9.5%, from the previous fiscal year-end to ¥19,001 million due mainly to the development of software. Investments and other assets increased ¥701 million, or 12.7%, from the previous fiscal year-end to ¥6,233 million. As a result, total assets at year-end decreased ¥5,422 million, or 4.4%, compared with the previous fiscal year-end to ¥117,398 million.
Total liabilities decreased ¥10,846 million, or 10.2%, from the previous fiscal year-end to ¥95,395 million. This was primarily the result of a decrease in trade notes and accounts payable of ¥8,750 million.
Total net assets increased ¥5,423 million, or 32.7%, from the previous fiscal year-end to ¥22,002 million. This was attributable mainly to the recording of ¥1,358 million in net income and a ¥3,432 million increase in foreign currency translation adjustments due to the impact of the weakening yen. As a result, the net assets ratio was 18.6%, an improvement of 5.3 percentage points from the previous fiscal year-end.
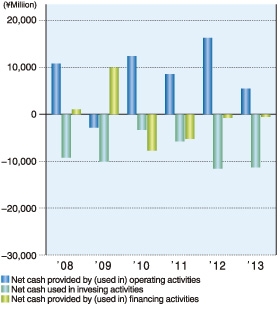
Cash Flows
Net cash provided by operating activities was ¥5,488 million. This was mainly because a decrease in notes and accounts payable was offset by the recording of income before income taxes and minority interests and depreciation and amortization as well as a decrease in notes and accounts receivable. Net cash provided by operating activities in the previous fiscal year was ¥16,304 million.
Net cash used in investing activities was ¥11,350 million. This was due mainly to payment for purchases of property, plant and equipment as well as payment for purchases of intangible assets. Net cash used in investing activities in the previous fiscal year was ¥11,587 million.
As a result, Clarion posted an outflow of free cash flow in the amount of ¥5,861 million compared with an inflow of free cash flow in the amount of ¥4,717 million in the previous fiscal year.
Net cash used in financing activities was ¥564 million. Net cash used in financing activities in the previous fiscal year was ¥751million.
As a result of these factors, cash and cash equivalents at the end of the year amounted to ¥5,564 million compared with ¥11,610 million at the previous fiscal year-end.
■Net Sales, Overseas Sales and Overseas Sales Ratio
■ Operating Income (Loss) and Operating Income (Loss) Ratio
■ Net Income (Loss) and Return on Sales
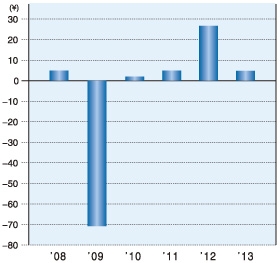
■ Net Income (Loss) per Share
■ Total Assets, Net Assets and Net Assets Ratio
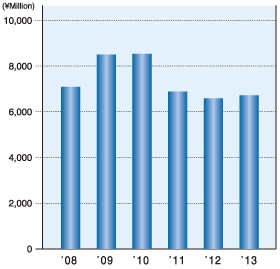
■ Depreciation and Amortization
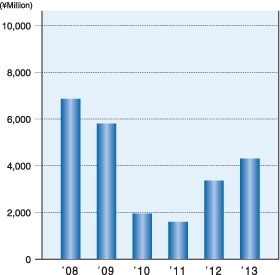
■ Capital Investment
■ Cash Flows
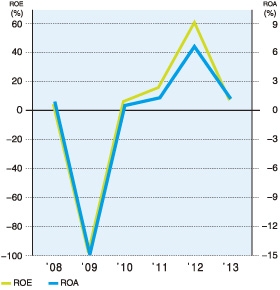
■ ROE and ROA